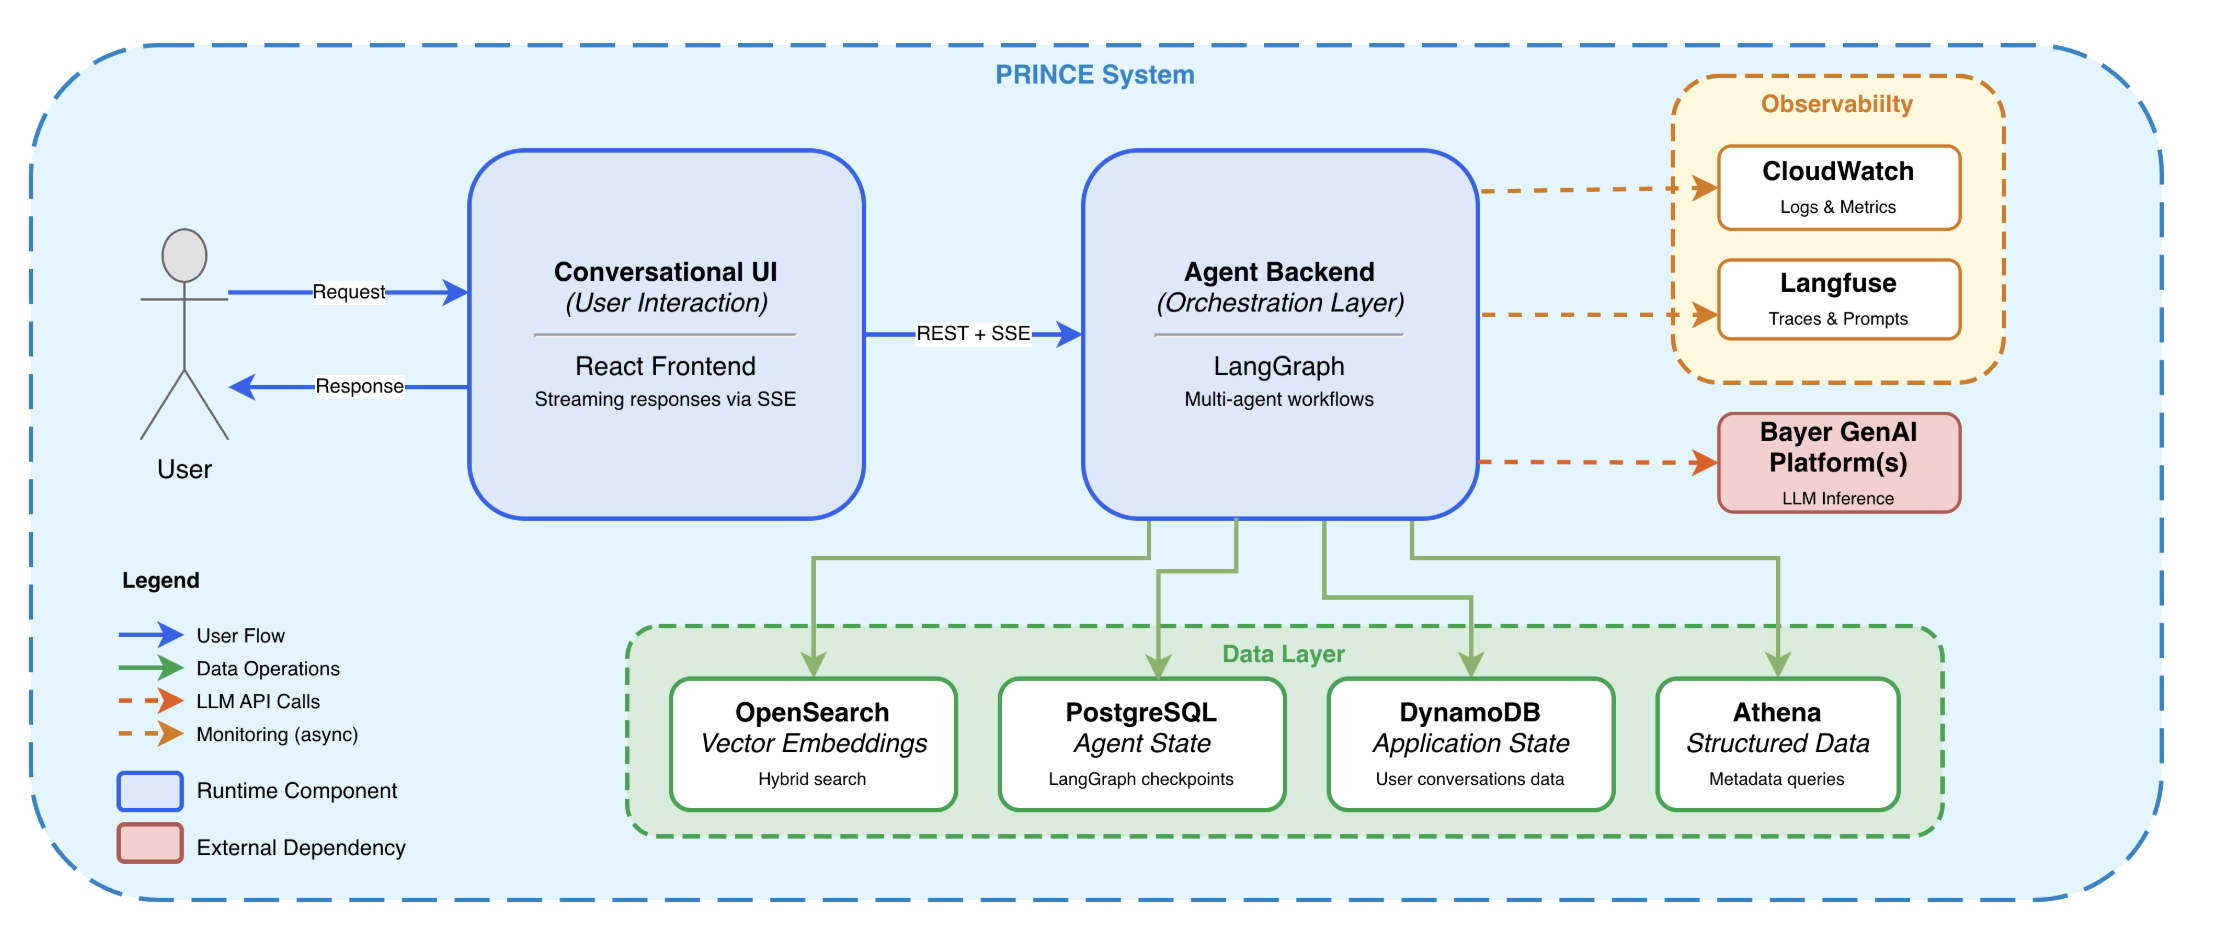
Bayer's PRINCE case study is worth reading because it shows what production agentic RAG looks like after the demo layer is stripped away. The system has a React conversational UI, a LangGraph backend, retrieval over unstructured reports, Text-to-SQL over structured data, persisted agent state, model routing, observability, and human review.
That architecture is useful beyond pharma. Any team building an agent over proprietary data eventually faces the same engineering questions:
- Which data source is authoritative for each fact?
- Which tool can the agent call for each class of request?
- Where does state live between steps?
- How do we inspect the trajectory when the final answer is wrong?
- Which failures block release, and which ones become production signals?
The PRINCE diagram gives technical teams a good starting map. The practical work is turning that map into a workflow-specific build plan and an evaluation loop that survives production traffic.
The Architecture Pattern
PRINCE separates the agent into surfaces with clear responsibilities.
The conversational UI manages request capture, streaming progress, final response display, citations, and review affordances. If a request takes 45 seconds and touches four tools, the user should see the system searching, querying, validating, and drafting.
The orchestration layer coordinates the agent path. In PRINCE, LangGraph manages steps such as clarification, planning, research, reflection, and writing. The value of the graph is inspectability: each node can have inputs, outputs, retries, state, and metrics. When a run fails, the team can identify the first bad step before debating the final answer.
The data layer separates retrieval, structured data, agent state, and application state. Vector search can recover report passages. SQL can answer exact questions over curated metadata. A checkpointer can persist graph state after each node. Application state can store conversations, user context, and review outcomes. Keeping these stores distinct makes permissions, freshness, and failure handling easier to reason about.
The observability layer captures what happened. A useful trace includes the user request, selected tools, retrieved chunks, generated SQL, fallback events, citations, latency, cost, and final output.
The model layer sits behind an interface. Once model calls are treated as dependencies, the team can route by task, add fallbacks, compare providers, enforce rate limits, and run controlled experiments without redesigning the product.
Map The Same Pattern To Your Workflow
The exact services will change. A support workflow might use Zendesk, Stripe, Postgres, and a help center. A finance workflow might use NetSuite, Coupa, email attachments, and a warehouse. A legal intake workflow might use a document store, CRM, matter database, and conflict-check API.
The control points stay consistent:
| Layer | Technical decision | Example implementation |
|---|---|---|
| UI | How users submit work, inspect evidence, and approve exceptions | Chat for research tasks; task dashboard for queue work |
| Orchestration | How steps are ordered, retried, interrupted, and resumed | LangGraph nodes with checkpointed state |
| Retrieval | How unstructured evidence is chunked, filtered, ranked, and cited | Hybrid search with metadata filters and reranking |
| Structured tools | How exact facts and business rules are queried | Read-only SQL, typed APIs, deterministic validators |
| State | What survives across turns, retries, and human review | Graph checkpoint, conversation record, review decision |
| Observability | What every run records for debugging and evals | Langfuse or OpenTelemetry traces with tool-call spans |
| Evaluation | What blocks release and what becomes a monitored signal | Local code-aware evals plus production trace review |
OpenNash starts with that table and fills it in for the actual workflow. The deliverable is a build specification: sources of truth, tool contracts, permission model, state model, failure modes, eval cases, release gates, and production metrics.
Build The Eval Loop Before Broad Autonomy
Ben Hylak's 2026 How to evaluate AI agents workshop makes a useful distinction: most production teams get more value from raising the floor than from chasing abstract benchmark wins. In agent systems, floor raising means finding the failures that would break user trust and engineering them out of the path.
That starts with trace review. For each failed or suspicious run, inspect:
- The user message and any selected domain or data source.
- The planned steps and selected tools.
- The retrieved context and structured records.
- The first step where the run diverged from the expected path.
- The final answer, citation behavior, refusal behavior, and user follow-up.
The useful question is specific: what was the last correct step and the first failed step? If retrieval missed the source document, a better writer prompt is the wrong fix. If SQL selected the wrong table, a stronger reranker is the wrong fix. If the evidence was thin and the writer still answered, the reflection or refusal policy needs work.
OpenNash turns those findings into a trace taxonomy. Typical categories include missing context, wrong tool, stale source, permission denial, malformed structured output, bad citation, overconfident answer, unsafe action, latency timeout, and human-review packaging failure. That taxonomy becomes the backbone of the eval suite and the production dashboard.
Code-Aware Evals For The Running Agent
Agent behavior lives in the whole system: prompts, tools, retrieval, permissions, state, and side effects. A useful offline eval runs the real agent path and asserts on the trajectory.
For a support agent, an eval might assert that the agent looked up the customer, retrieved the refund policy, refused to refund an ineligible order, and escalated with the right reason. For a finance agent, it might assert that the agent extracted the invoice total, matched the PO, detected a duplicate invoice number, and avoided creating a payment. For a research agent, it might assert that the answer cites the correct source passages and declines when evidence is insufficient.
An offline eval here is a test, not a score:
describeEval("payment exception agent", { harness: paymentAgentHarness() }, (it) => {
  it("escalates an unmatched invoice above threshold", async ({ run }) => {
    const result = await run("Review invoice INV-4821 from Acme Logistics")

    expect(result.output.status).toBe("needs_review")
    expect(result.output.reason).toContain("no matching purchase order")
    expect(toolCalls(result.session).map((call) => call.name)).toEqual([
      "lookupVendor",
      "lookupInvoice",
      "lookupPurchaseOrders"
    ])
    expect(result.sideEffects.paymentsCreated).toHaveLength(0)
  })
})
This is the kind of harness OpenNash builds into agent projects. The first version can be small: 5 to 10 golden cases that cover critical paths. Then production failures add targeted regression cases only when they represent a class of failures worth preventing. We also prune cases that have not failed in three months, so the suite stays small enough for engineers to trust.
Production Monitoring By Volume
Once the agent is live, the evaluation loop changes. Offline evals protect known behavior. Production monitoring discovers new failure patterns from real users.
For low volume, read the raw traces. At 10 to 100 runs per day, the best monitoring tool is still a technical operator reading user messages, tool calls, retrieved context, and final answers until patterns repeat.
At moderate volume, group repeated failures into issues. If the same context-loss pattern shows up across renewal questions, turn it into an issue with examples, owner, fix hypothesis, and expected metric movement.
At higher volume, track signals. Useful signals include refusal quality, ignored tool errors, repeated user correction, low citation coverage, high fallback rate, timeout rate, and human override rate.
At scale, run experiments. Ship a model, prompt, retrieval, or tool change behind a flag and compare the affected issues and signals. The offline suite tells you whether the change broke golden cases. Production data tells you whether it improved the workflow.
We operationalize the volume-tiered review model Hylak describes with OpenNash-owned artifacts at each stage:
| Volume | Review mode | OpenNash artifact |
|---|---|---|
| 1-100 runs/day | Raw trace review | Trace review notes and failure taxonomy |
| 100-1,000 runs/day | Recurring issues | Issue backlog with examples and owners |
| 1,000+ runs/day | Signals | Metrics dashboard and alert thresholds |
| 5,000+ runs/day | Experiments | Flagged changes with before/after comparison |
This is where the PRINCE-style observability layer becomes operationally valuable. Traces support incident debugging, eval design, product improvement, and release decisions.
Where Human Review Belongs
Human review should be reserved for the decisions that need judgment or carry high cost. Gate payments, customer commitments, legal statements, regulated outputs, data deletion, and actions outside the agent's allowed boundaries. Sample lower-risk work after the fact.
The review payload matters. A useful escalation includes the proposed action, the evidence, the rule or threshold that blocked autonomy, the recommended options, and the cost of each option. A reviewer should decide from the package in front of them, without reconstructing the whole trace manually.
OpenNash designs the review surface alongside the agent. For a finance workflow, that might mean a review card with invoice, vendor, PO match status, duplicate check, variance from historical spend, and approve/hold/reject actions. For a support workflow, it might mean policy excerpts, customer tier, prior contacts, suggested reply, and escalation reason.
What OpenNash Ships With This Build
For a technical team, OpenNash is most useful where the agent crosses from prototype to production:
- Agent architecture spec: A one-page source-of-truth map and tool contract. For every fact the agent uses, the spec names the authoritative system. For every tool, it states read-only, write-capable, or approval-gated. For every long-running path, it names where state is checkpointed across retries and human review.
- Code-aware eval harness: A local
describeEval-style harness wired to the actual agent runtime. It asserts on tool-call order, structured output, persisted state, citations, and side effects, then runs as a CI gate in under five minutes. - Golden-case suite: A starter set of 5 to 10 real production cases, never synthetic examples, each pinned to an expected trajectory. The first month of live failures becomes targeted regression coverage only when the failure represents a class the team expects to see again.
- Trace taxonomy: Tool-call spans in Langfuse or OpenTelemetry, triaged by first failed step. Each category ships with examples and a reproduction path, so fixes land in retrieval, tools, prompts, state, permissions, or UX and avoid vague prompt churn.
- Production monitoring: Volume-appropriate review: raw-trace reading under roughly 100 runs per day, an issue backlog with owners as patterns repeat, tracked signals for refusal quality, ignored tool errors, citation coverage, fallback rate, and human override rate, plus before/after comparison for flagged changes.
The Practical Checklist
Use the PRINCE architecture as a reference, then answer these questions for your workflow:
- What are the 5 to 10 golden cases the agent must handle before launch?
- Which source is authoritative for each fact the agent uses?
- Which tools are read-only, which can write, and which require approval?
- What should the agent do when evidence is missing: ask, refuse, escalate, or continue?
- What does a trace need to capture so an engineer can find the first failed step?
- Which eval failures block release?
- Which production signals show the agent is losing user trust?
Answer the seven questions above and the PRINCE diagram becomes a build spec: the architecture defines the controllable system, and the eval loop defines how it improves after launch.